Multiple Myeloma Extraction
Produce a small set of genuinely different charts from evaluation_matrix.csv (12 agent+model combinations scored against a ClinicalTrials.gov extraction benchmark) that each answer a distinct question a user would ask when choosing between models: "which is…
Runs on Jetty's managed sandbox. No setup. Free for your first 10 runs.
Real runs, real outputs.
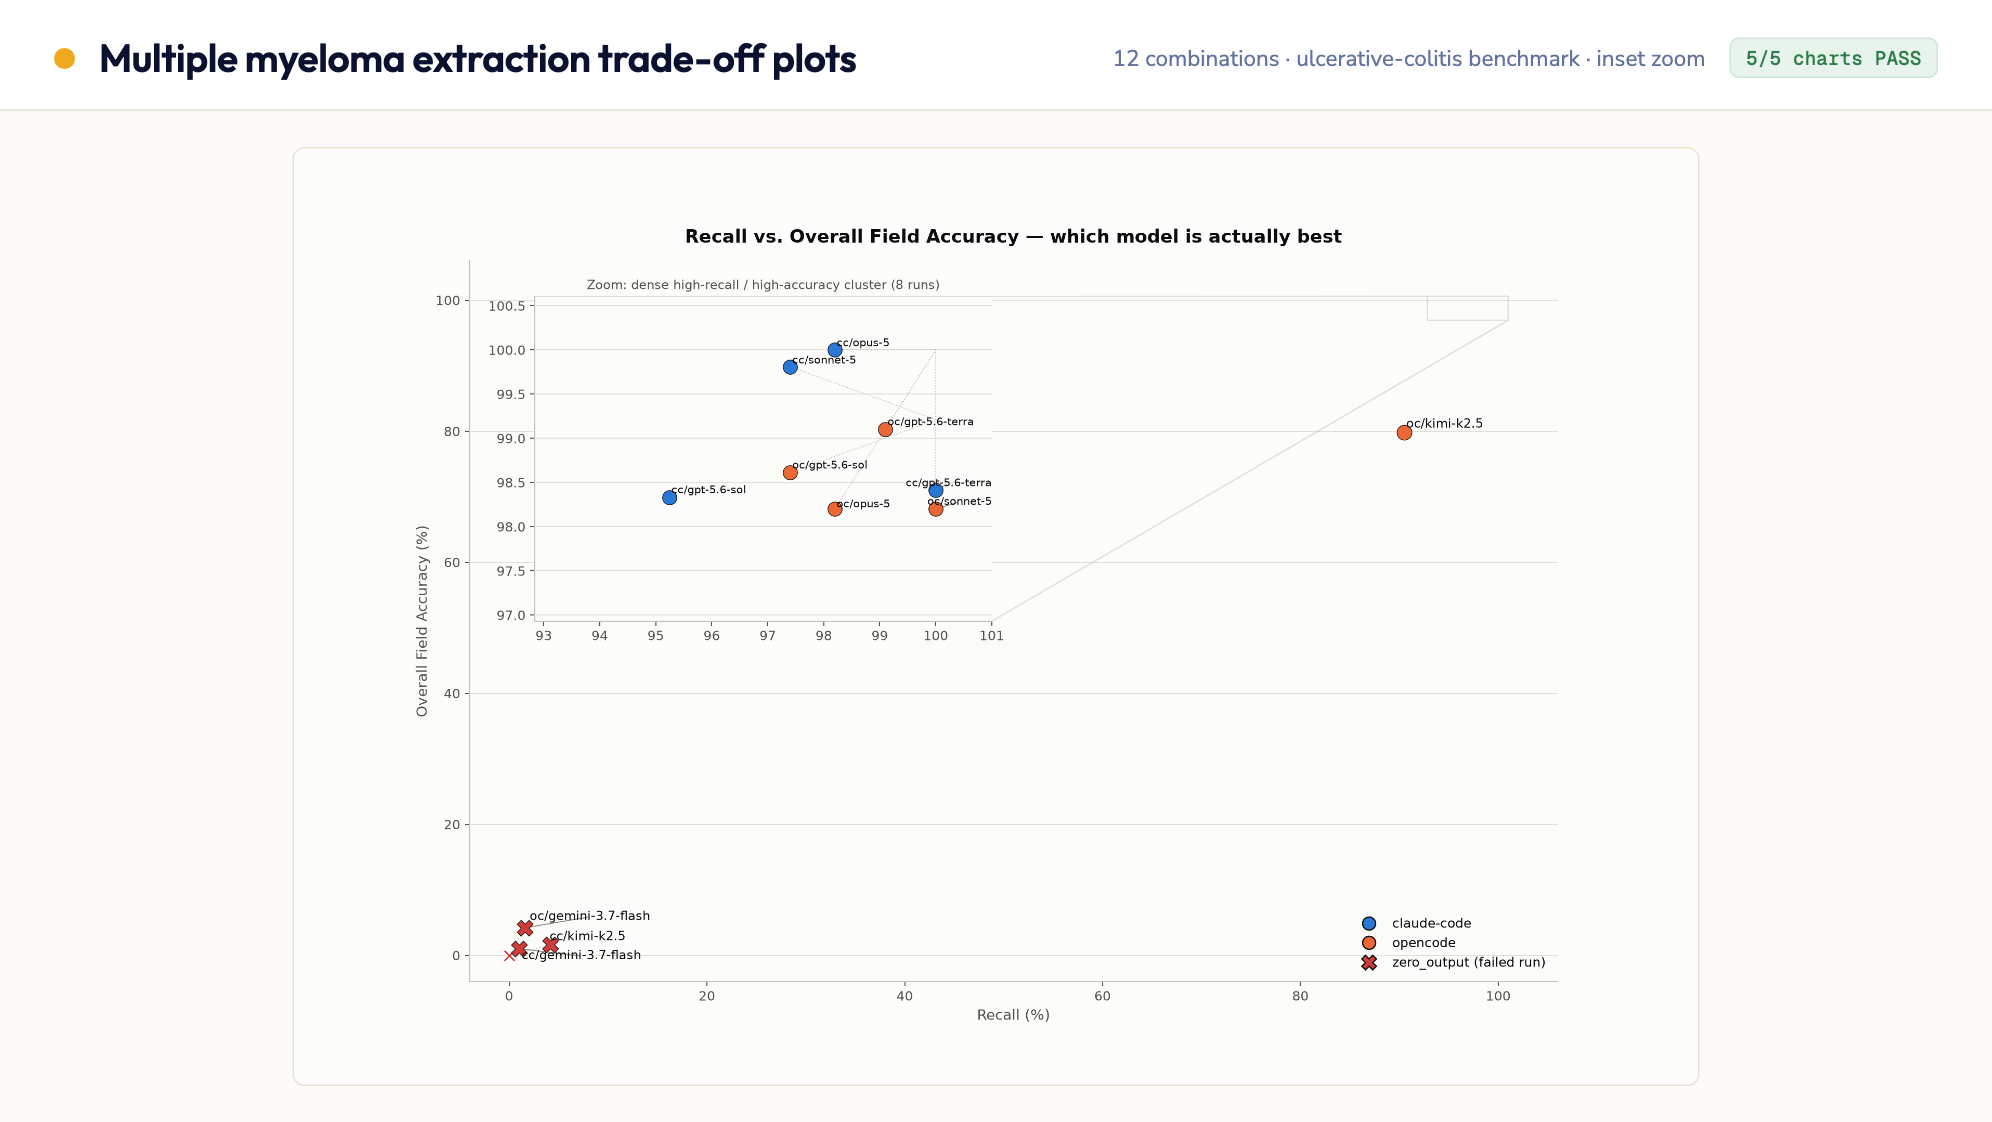
A different 12-combination matrix — ulcerative-colitis benchmark (inset zoom)
Same runbook, a different evaluation matrix: 6 models x 2 agents scored against a 21-study ulcerative-colitis benchmark, where eight strong runs pile into the 95–100%…
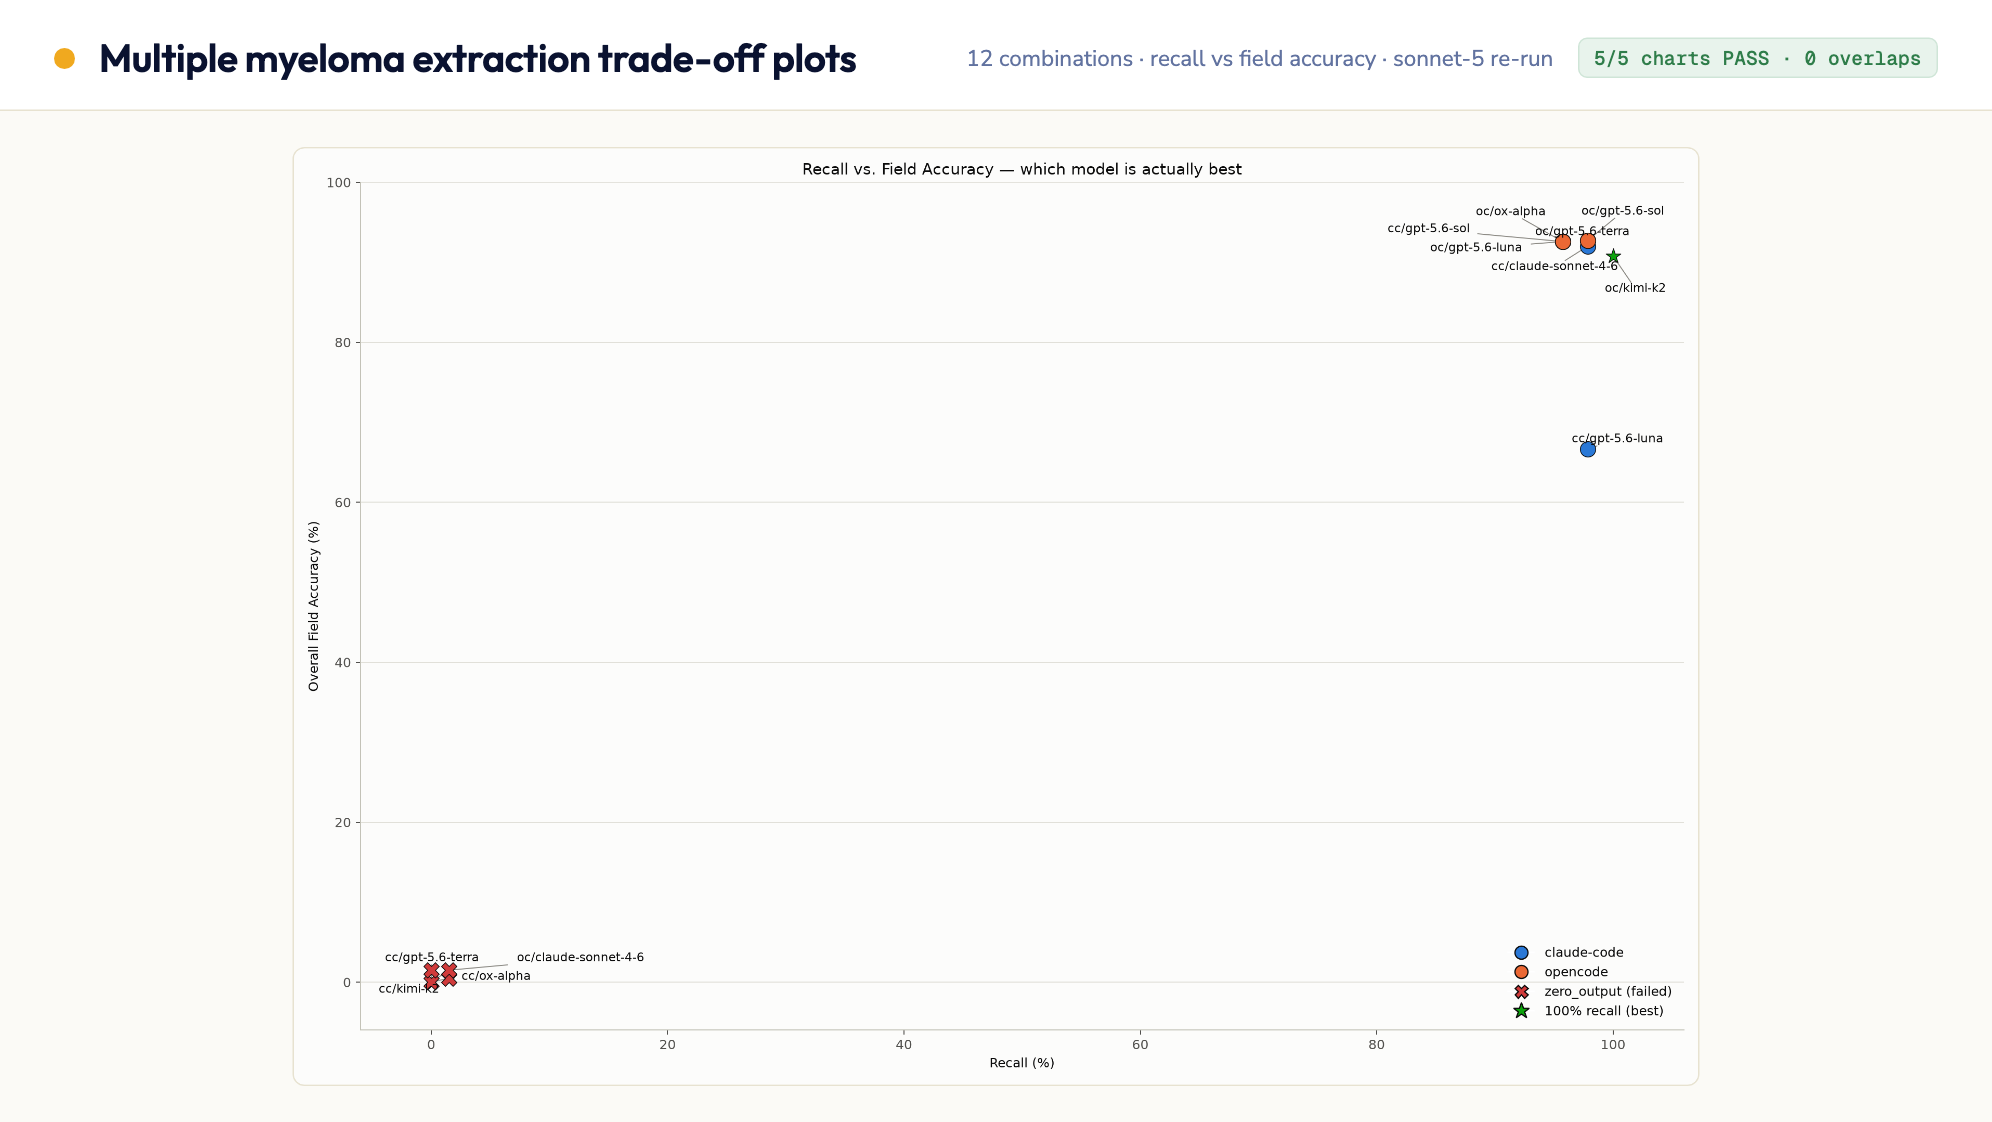
Same 12-combination matrix, re-run on claude-sonnet-5 via OpenRouter
Reproducibility check against the current runbook (v1.2.1, portable OpenRouter routing): all five charts rendered clean on the first attempt, the in-code zero-overlap…
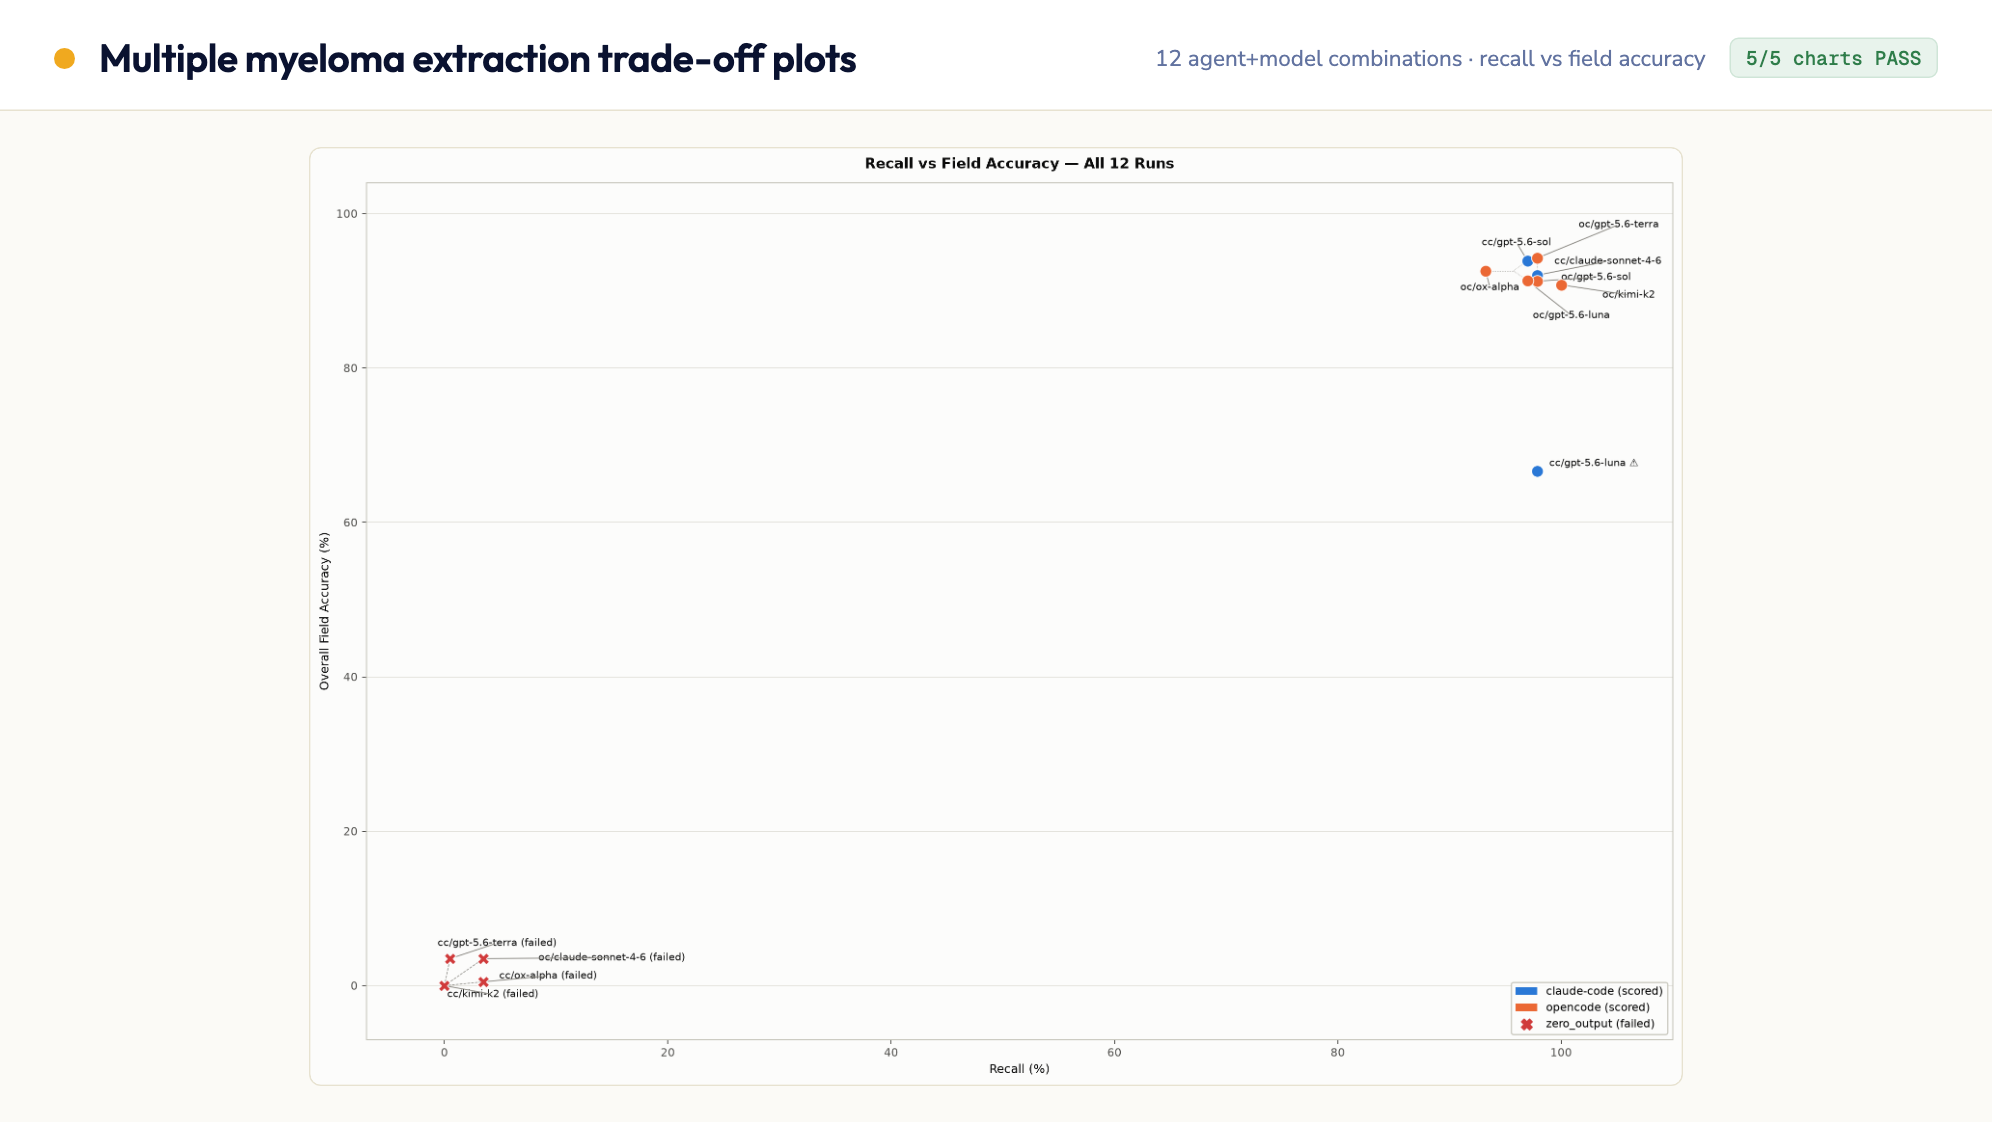
12 agent+model combinations, MM extraction benchmark
All 5 charts rendered clean — every one of the 12 combinations individually labeled with zero overlapping labels, palette and chart-form rules followed exactly.
9 steps · start to finish.
- 1Step 1
Environment Setup
▶pip install pandas matplotlib adjustText mkdir -p {{results_dir}}/charts - 2Step 2
Design System — Use These Exact Values (Do Not Substitute)
▶This is a validated, colorblind-safe palette. Use it exactly — do not pick your own colors, do not use a matplotlib default cycle, do not use a rainbow/jet colormap.
- 3Step 3
Compute Derived Data
▶Write and run a Python script that:
- 4Step 4
Render the 5 Charts
▶Build each chart from Step 3's computed data using matplotlib and the exact palette from Step 2. For recall_vs_field_accuracy.png and recall_vs_runtime.png, color each point by its agent value using…
- 5Step 5
Evaluate Outputs
▶Status · Criteria PASS · All 5 PNGs exist, are non-trivial in size (>15KB), use the specified palette, have a legend where 2+ series are present, no chart uses a dual y-axis or 3D/pie form, every…
- 6Step 6
Iterate on Errors (max 3 rounds)
▶If any chart fails Step 5's criteria, fix the specific issue (palette substitution, missing legend, dual-axis violation, blank render, missing combination, overlapping label) and re-run. After each…
- 7Step 7
Write Executive Summary
▶Write {{results_dir}}/summary.md with one clearly-labeled section per chart (matching the 5 filenames), each containing: what the chart shows, and a one-sentence takeaway. Follow with a short "Which…
- 8Step 8
Write Validation Report
▶Write {{results_dir}}/validation_report.json:
- 9Step 9
Final Checklist (MANDATORY — do not skip)
▶echo "=== FINAL OUTPUT VERIFICATION ===" RESULTS_DIR="{{results_dir}}" for f in "$RESULTS_DIR/charts/recall_vs_field_accuracy.png" "$RESULTS_DIR/charts/recall_vs_runtime.png"…